This is my old Forex System but it still works !
Hi pal,
Do you tired looking for the forex strategy that can make money continuosly ?, if you do , great you’re at the right place.
You can call me Prasxz , actually I’m a programmer who interested in FOREX technical analysis, after I loss amount of money in this business , I start to asking into my self , why every I enter the market , its always against me ?, is there any proven system outhere that can avoid me being loss?
This system is FREE OF CHARGE.
For example :
You’re trading GBP for 10 times , how many times you loose your trade ? and how many times you’ve got your profit ?
If the answer is 8 wins and 2 losses, then you’re at the right system that match your style , next question is , can you keep your system working in the next 20,40,60,80,... trading round ?
If the answer is yes, please stop reading this strategy and keep your system on your side..
If no, may be I can help you here..
I will give you a simple trading system that has proven gave me minimum 20 pips/day ..not bad isn’t it ? and I still use this system as you see this blog.
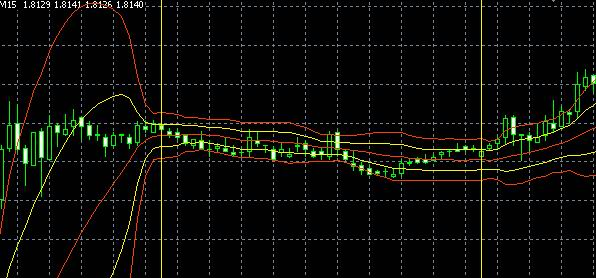
Let’s see below MetaTrader 4 picture for 15 m GBP chart.
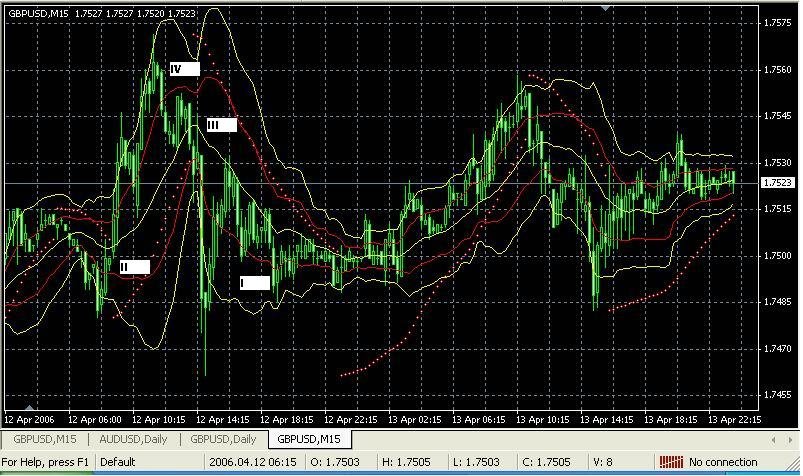
I used only 2 indicators :
- 2 Bollinger Band with parameter :
Period : 20 Deviations :1 Apply to :Close
Period : 20 Deviations: 2 Apply to: Close
This 2 Bollinger Band divide the area into 5 lines
- Parabolic SAR (Stop and Reverse) with parameter :
Step : 0.01 Maximum: 0.2
Bollinger Band
These 2 Bollinger Band can tell you, where the market will go on the next stage.
If the bar from below touched the line V it means please be prepared for the reversal into line IV. (In case there’s no bullish signal from higher time frame)
If the bar from above crossed the line IV it means please be prepared for the bar touched the line III.
If the bar from above crossed the line III it means please be prepared for the bar touched the line II.
If the bar from above crossed the line II it means please be prepared for the bar touched the line I.
If the bar from above touched/crossed the line I it means please be prepared for the reversal into line II.(In case there’s no bearish signal from higher time frame).
There are the possibilities for the market move on 2 Bollinger Band stage, you can examine this indicators to make sure or perhaps backtesting and forwardtesting on Meta Trader 4.
Parabolic SAR
Use this indicators to determine the entry point and trailling stop.
PSAR strategy is BUY when the PSAR dot appears below the bar and SELL when the PSAR dot appears above the bar.
When the right time for me to BUY/SELL ?
Where I placed my stop loss ?
You should take BUY position when the FIRST PSAR dot appears below the bar and take SELL position when the FIRST PSAR dot appears above the bar.
Term of FIRST here is very important because this is a good chance for you to take a maximum pips, close your position when you gain 10 – 30 pips or more perhaps depend on market situation.
Place a STOP LOSS at the first PSAR dot when you already enter the market and trail it into next PSAR dot.
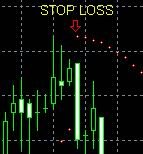
How many pips I should place my stop loss ?
It depend on your style, if you willing to place stop loss for 20 – 40 pips you should use 15 minute chart to gain profit between 10 – 30 pips or more , use the higher time frame if you want to gain bigger profit and of course your stop loss pips will be increased...you can try it because this system works in all time frame, depend on your style and equity.
I’m convenience using 15 m chart because the smaller stop loss pips and it doesn’t take too many time to gain 10 – 30 pips / day.
STRATEGY
BUY whenever FIRST PSAR dot appears and the bar lies above line I or above line II , target is next line.
SELL whenever FIRST PSAR dot appears and the bar lies below line V or below line IV , target is next line.
You can take position in all line depend on market situation , the most important is you must action when the FIRST PSAR dot appears.
Use this system consistently, if you loose your trade, you must switch position in the next FIRST PSAR dot .
OK that’s it , cut your losses and let your profit run...
PS : I don’t have experience using C language ..if there’s somebody would like to make EA (Expert Advisor) in MT4 base on this system ,you can share with me.
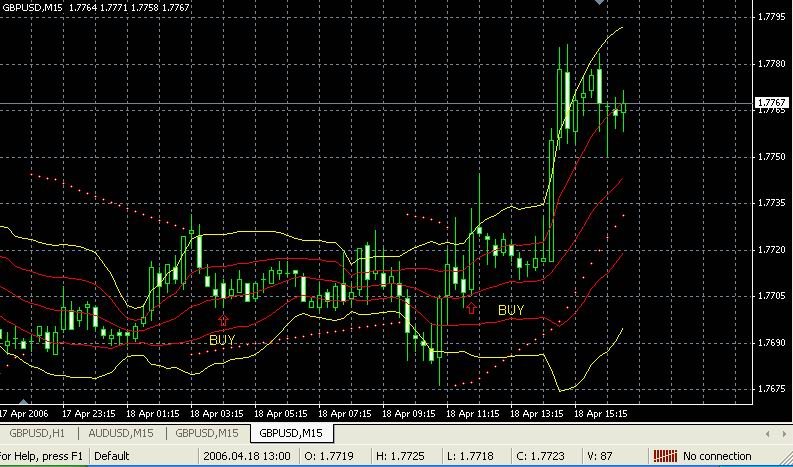
Case I :
hi all,
I'll show you about signal generated by the system, remember if the first PSAR appears and the price is at line V just wait until the price move back to line IV,III,II or I as long as the bar not touched the signalthen take position like below picture..
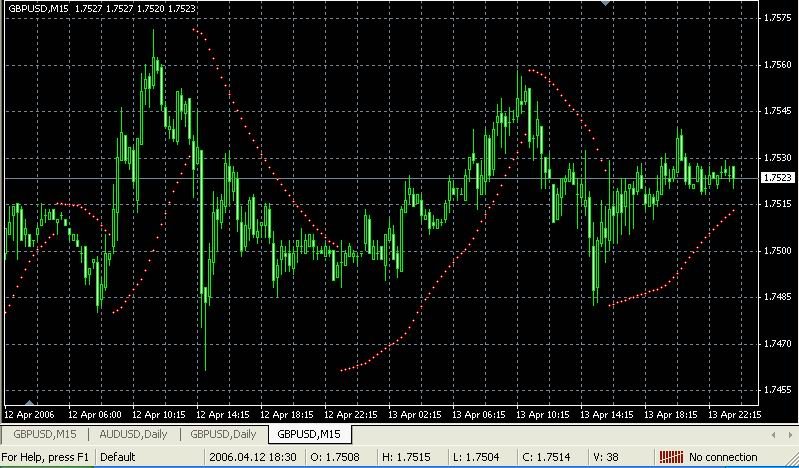
Case II
If you found ranging market or sideway trend like below picture ,you should wait and see till
long bottleneck end . Distance between line V and line I usually no more than 30 pips .
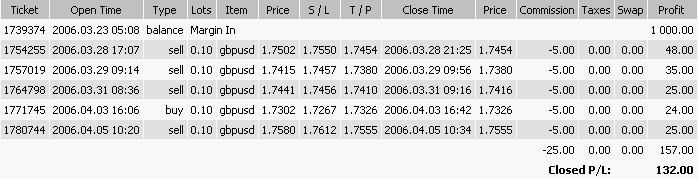
Below picture is sample of my balance sheet statement using this system...
posted by Prasxz @ 8:11 AM
![]()


54 Comments:
are you currently using this? How well does this work for the other majors USD/JPY, EUR/USD, USD/CHF?
I will be looking at it in the weeks to come. Do you want me to post my results?
jesseboy
my question is regarding when to buy/sell. On the jpeg you attached you showed where to buy.
http://photos1.blogger.com/blogger/2696/2678/1600/post.0.jpg
From what you said above this picture you should buy when the the candle is above lines 1 and 2 and first PSAR dot appears. if this is the case I would have wanted to buy 3 candles earlier than where you had marked on this screenshot for the first buy entry.
This would have resulted in a loss. Please explain this
thanks, this looks like it has some great potential.
jesseboy
I guess the main question I have is: when you make the statment that you should buy when the first PSAR dot appears below the candle and the candle is above lines 1 or 2. Does this mean that if it's above lines 5 we should buy. I noticed that on your screenshot this was almost the case. It was above line 4 and the PSAR dot appeared below the candle. I need some clarification on this.
thanks
jesseboy
Hi JesseBoy,
>are you currently using this? How well does this work for the other majors USD/JPY, EUR/USD, USD/CHF?
>I will be looking at it in the weeks to come. Do you want me to post my results?
Yes I always use this one for my entry and exit point..it 's works well to me..currently i used this only for GBP ..
it should works for other currency too.
please post your results ..i will apreciate it...
>From what you said above this picture you should buy when the the candle is above lines 1 and 2 and first PSAR dot >appears. if this is the case I would have wanted to buy 3 candles earlier than where you had marked on this screenshot for >the first buy entry.
Please remember buy signal appears when first PSAR dot come..if you do entry point before it...you should compare your chart with higher time frame ..if on higher time frame PSAR dot lies below the chart...it means price will go higher..so you can take your position...you'll get better result if you do this and you should place stop loss on higher time frame PSAR dot.
>It was above line 4 and the PSAR dot appeared below the candle. I need some clarification on this.
like i told you above you should compare to a higher time frame..if you adoubt it ..it will prevent you for take wrong position..
if there's PSAr dot appeared below the candle and it was above line 4..i guess it's strong bullish movement or waiting for SELL signal appears...wait and see is recomended for this case..
Thanks for your comment...
Cheers,
Prasxz
Prasxz,
I have been looking at your interesting system since you kindly posted it a couple of months ago. It looks quite simple but obviously a lot of thought has gone into it. I have a few questions about this which I would be grateful for an answer to:-
1. Are you still making profits with this approach since you posted some trades.
2. When I have some time next month I would like to ask a few short questions about this system.
Will you be able to try to answer them please?
3. Will you be able to carry on with your blog assuming you are still making profits with this approach? It seems such an exciting blog and it would be a shame to just to leave it.
regards,
Andrew
1. Are you still making profits with this approach since you posted some trades.
Depend on market movement..if all signals confirmed then i can make profit..but totally on every 20 trading round
16 wins and 4 losses
2. When I have some time next month I would like to ask a few short questions about this system.
Will you be able to try to answer them please?
With my pleasure
3. Will you be able to carry on with your blog assuming you are still making profits with this approach? It seems such an exciting blog and it would be a shame to just to leave it.
Yes..but within a weeks or 2 weeks..i will optimize this system using another indicator..
would you please waiting for my update to come
cheers,
prasxz
Thanks for the reply :)
Hi,
U mentioned that at the first PSAR dot below the price bar indicates BUY, its a entry point. If the price hits line 3 and above, it is wise to make a entry? U mentioned it's very important to make entry on the first PSAR dot, does it applies to every line from I to V? For your info, I am using EURO/USD.
hi,
i dont really understand what you mean with first psar dot.
If there are example a row of dots above the bar, is the first dot then the first dot under the bar, or something else?
Am i allowed to buy if the whole bar (at candlesticks) is over line 1 or 2 or if only the middle part (the fat part at candlesticks) is over line 1 or 2. And am i only allowed to buy if the bar is ONLY above line 1 or 2, or shall i also buy when the line is for example above line 3?
I would be glad about an answer :)
Greets mike
Hi Prasxz
I'm sorry but i"m still confused about buy and sell. I'm looking at a chart on which the first PSAR dot signaled a BUY. The price bar is on line V. Should I avoid this trade because the price bar is not at line I or !! ?
Thanks Sherm
Hi Sherm,
if bar is above line 3 you should compare with higher time frame
if position psar on higher time frame same as entry point time frame
(above or below bar ).
then you can take position base on first psar dot appears.
regards,
prasxz
what do u mean by above or below bar?
I understand what u mean by above or below bar. thanks..
Hi prasxz,
Can you explain what do u mean by this? I'm dun really get what you are trying to say.. Thanks...
if bar is above line 3 you should compare with higher time frame
if position psar on higher time frame same as entry point time frame
(above or below bar ).
then you can take position base on first psar dot appears.
hi Shaun,
if bar is above line 3 you should compare with higher time frame:
eg.your entry point is on 15 m chart (where first psar dot appears) but it lies above line 3 , you should compare
with 30 m or 1 h chart to compare a position of psar dot, if position of psar dot is same as your entry point chart then
you can take entry point.
Cheers,
prasxz
for the higher time frame charts, does the position of the psar dot need to be at the exact point? What if it is slightly further away then entry chart?
And you mentioned (above bar or below bar), let's say my 15m first psar dot appears below bar, it signals a BUY. So I switched to 1h chart to compare. Does it matters the position of psar dot signals buy or sell on 1h chart, or both psar position on both charts must signal BUY? Sorry for asking so many questions.. But I'm seriously think you are brilliant to come up with such system...
Hi Shaun,
thanks for your comment,if you compare the entry point time frame with higher time frame you have to make sure
that position psar dot must have same signal it doesn't matter that psar dot already go further on higher time frame
the most important is they're all have same signal buy or sell.
Why ?
If entry point taken on 15 m chart ..everyone wish that within next 1h market direction still the same .isn't it?
cheers,
prasxz
Hi prasxz, gotten your point.. Have u come across time like 8.30 est to 9.00 est? The market flunctuates very much at this timing, do u stay out or continue trading if the criteria of ur system meets?
Hi Shaun,
My system is not based on time session...market flunctuates
is our chance to make profit of course if all signals confirmed
Cheers,
Prasxz
Hello prasxz,
I like your interesting blog. Prasxz would you be kind enough to post one or two of your recent trades on the blog please graphically showing how you entered and exited the trade? I feel that the more examples there are of this system the easier it is to understand the technique and I really could benefit from some more explanation. I would be very grateful for our help.
With kind regards,
Andrew
Hi Andrew,
Sorry for late reply..
I will provide it soon ...just wait my new update...
Thanks
Cheers,
prasxz
Hi Prasxz
have you started improving the startegy with an additional indicator?
Maybe an oversold/overbought indicator such as RSI or CPI?
Ran.
Hi Ran,
Yes now i'm still improving my system using camarrila pivot, fractal and stochastic...if u have any suggestion i'm very glad to know it...thanks,
Cheers,
prasxz
prasxz,
I like to ask you a dump question. I couldn't find line V in the chart. Can you explain little more about which line
is which line.
I am a novice in forex.
thanks
Elton
Hi Elton,
line 1 - 5 start from below to above of bollinger band.You see there are 5 lines ,line 1 lies on the bottom and line 5 lies on the top of a picture.
Cheers,
Prasxz
Hi,
thanks for visiting my blog..
if you want to know more about forex system you can go here http://www.freefxsystem.com
choose your system according to your style...
Cheers,
prasxz
Hi Prasxz,
How do you set these indicator in MT4? You have couple indicators like bunnygirl, catfx50 etc which are the most you use?
Elton
Hi Prasxz,
I was investing in stock market for while. I tried position trading but I never have any good return. I am new in FX, any sugguestion how to make a good start, a lot of others saying to get a demo account, I think I should do that too. However, I see so much info but you
never know which is good or bad, everyone has own opinion but I think most of us don't have a righ direction to move on that why there are 95% of us end up loosing money instead of making a living.
It seems you are doing good so I am asking your way to start and how to keep it up.
thanks for your sharing.
Elton
Hi Elton,
just copy those indicator in indicator folder then open it press F5 , close, then open mt4 again..you'll see that indicator.
I prefer use CatFX50...this indicator is simple and powerful...just try it.
for the first time you should try demo account with system you'd choose...then optimize your system daily until you get good return..after that try to go a live.begin with 1 lot to trade..don;t forget to place stop lose.just keep your good system consistently.discipline is no.1 ,and don't forget to read fundamental news daily...try it..
btw..i'm online using ym ID:moneyontheway we can chat there
happy trading
Cheers,
prasxz
Interesting System i will try it out for sure!
The Forex Profiteer Blog - Free Tutorials, Systems, Strategies and information on the forex
Hi Prasxz :)
I just wanted to know what is your rough estimate for when the update for this strategy will be ready?
regards,
Andrew
Hi Andrew,
I'm very sorry for my new system here...few days ago i found new indicator and now being tested for couple day...after that i will write a documentation for that...
Please add one indicator to this system .Stochastic with parameter
%K :9 %D : 3 Slowing : 3. try it..
Cheers,
Prasxz
boleh gue coba your sistem
Bill says I'm crazy but I think forex trading advice is worth looking into.
Hi prasxz!
I'm still realy interested in your "old" system. I think it's beautiful and i thank you for it!
So i have 1 question about it. Have you got any alert on it? Some sound signal or message box when "whenever FIRST PSAR dot appears and the bar lies above line I or above line II" or "FIRST PSAR dot appears and the bar lies below line V or below line IV"?
I think it's really serious because without this signals you have to sit near the monitor 24 hours per day. Isn't it so?
Can we conversate about it? Could you give me some of your minutes? I'll be very thankful to you for this.
Hello !.
might , perhaps very interested to know how one can reach 2000 per day of income .
There is no need to invest much at first. You may start to get income with as small sum of money as 20-100 dollars.
AimTrust is what you haven`t ever dreamt of such a chance to become rich
The firm represents an offshore structure with advanced asset management technologies in production and delivery of pipes for oil and gas.
It is based in Panama with affiliates everywhere: In USA, Canada, Cyprus.
Do you want to become an affluent person?
That`s your chance That`s what you desire!
I feel good, I started to get income with the help of this company,
and I invite you to do the same. It`s all about how to choose a correct partner who uses your savings in a right way - that`s it!.
I make 2G daily, and what I started with was a funny sum of 500 bucks!
It`s easy to get involved , just click this link http://ybuzycakuq.fcpages.com/acoqyg.html
and go! Let`s take our chance together to become rich
Good day !.
You re, I guess , probably curious to know how one can collect a huge starting capital .
There is no need to invest much at first. You may start to receive yields with as small sum of money as 20-100 dollars.
AimTrust is what you need
The company represents an offshore structure with advanced asset management technologies in production and delivery of pipes for oil and gas.
Its head office is in Panama with structures everywhere: In USA, Canada, Cyprus.
Do you want to become an affluent person?
That`s your chance That`s what you desire!
I feel good, I started to take up income with the help of this company,
and I invite you to do the same. It`s all about how to choose a correct companion who uses your funds in a right way - that`s AimTrust!.
I make 2G daily, and what I started with was a funny sum of 500 bucks!
It`s easy to start , just click this link http://zomurezi.o-f.com/ewybysi.html
and lucky you`re! Let`s take this option together to feel the smell of real money
I've just recently bought Mt4 Protect and wanted to tell you guys about my experience with it.
I was worried about all the Metatrader Trojan Horse's out there at the moment as I heard you can get them from downloading EA's from the internet.
While I don't download decompiled forex robots the last thing I want is some hacker getting my account details and draining my trading account as I have built it up into quite a bit of cash. That's why I purchased MT4 protect so it can stop my pc from getting attacked. I think the price is well worth the protection I will receive
I got a copy at [url=http://www.mt4protect.com/] http://www.mt4protect.com/ [/url] via paypal and my product code was sent to me within 4 hours.
I installed it and its wicked! It works in the system tray and scans my computer in real time to detect any attacks.
The EA optimization tool is so great - you can allocate more memory to your MT4 terminal so your trades get executed faster! There are also heaps of registry tweaks and cleanup features that have turbocharged up my Windows XP computer.
With hackers and virus attacks hitting Forex traders all the time now I definitely think that MT4 Protect is a worthwhile investment.
[url=http://cpcheat.org/]Club Penguin Codes[/url] provides you with a [url=http://cpcheat.org/club-penguin-money-maker/]Club Penguin Money Maker[/url] that permits you to make a lot of coins in Club Penguin.
[url=http://cpcheat.org/]Club Penguin[/url] also provides you with [url=http://cpcheat.org/club-penguin-trackers/]Club Penguin Trackers[/url] such as a [url=http://cpcheat.org/club-penguin-aunt-arctic-tracker/]Club Penguin Aunt Arctic Tracker[/url], a [url=http://cpcheat.org/club-penguin-cadence-tracker/]Club Penguin Cadence Tracker[/url], a [url=http://cpcheat.org/club-penguin-gary-tracker/]Club Penguin Gary Tracker[/url], a [url=http://cpcheat.org/club-penguin-band-tracker/]Club Penguin Band Tracker[/url], a [url=http://cpcheat.org/club-penguin-rockhopper-tracker/]Club Penguin Rockhopper Tracker[/url], and a [url=http://cpcheat.org/club-penguin-sensei-tracker/]Club Penguin Sensei Tracker[/url].
Finally,[url=http://cpcheat.org/]Club Penguin Cheats[/url] gives you [url=http://cpcheat.org/club-penguin-bots/]Club Penguin Bots[/url] and [url=http://cpcheat.org/]Club Penguin Mission Cheats[/url] and [url=http://cpcheat.org/]Club Penguin Coin Cheats[/url]
Good day, sun shines!
There have been times of troubles when I didn't know about opportunities of getting high yields on investments. I was a dump and downright pessimistic person.
I have never thought that there weren't any need in big initial investment.
Now, I feel good, I begin take up real money.
It gets down to select a correct companion who uses your funds in a right way - that is incorporate it in real deals, parts and divides the income with me.
You can get interested, if there are such firms? I'm obliged to tell the truth, YES, there are. Please get to know about one of them:
http://theinvestblog.com [url=http://theinvestblog.com]Online Investment Blog[/url]
Howdy
I just joined this lovely site. I found loads of useful information here. I would also like to add some thing for this community. I would like to share some [url=http://www.weightrapidloss.com/lose-10-pounds-in-2-weeks-quick-weight-loss-tips]quick weight loss tips[/url]. If you want to know how to lose 10 lb in a week, you are likely not searching for a basic dieting and exercise plan. You can lose weight with a regular diet and work out plan, Still this demands a lot of time doing utmost cardio works out and sticking with a strict diet. Here I will outline the exact steps that I took to lose 10 pounds in just a calendar week.
1. Stay away from all deep-fried nutrients for the week
2. Drink In an 8oz glass of Citrus paradisi with breakfast every day. (this speeds up your metabolism)
3. Eat fair portions (stop eating when you are full)
4. Rather than eating 3 big a meals a day, take 5-6 small meals to keep your metabolism up and keep your body burning fat.
5. Do not eat anything after 9pm. When you eat that late your body does not burn off the calories.
6. Proper sleep is necessary everyday.. Not having enough sleep has been proved to be a major factor to the body putting up excess fat.
7. Use a body/colon cleanse for the 7 days. This will get rid of excess fat stored close to the stomach area as well as cleanse your body of harmfull pollutants that makes you store fat and feel tired. Flush away excess pounds around the stomach area that otherwise would be hard to lose.
8. I reccomend you using Acai Berry Diet Pills. This one is tested to work, and you can get a free trial.
9. For those individuals who want to burn fat quickly, avoid alcoholic drink.
10[url=http://www.weightrapidloss.com/lose-10-pounds-in-2-weeks-quick-weight-loss-tips].[/url] A low GI diet is an outstanding method of loosing fat quickly.
Thanks![url=http://www.weightrapidloss.com].[/url]!
like gambling? love las vegas? deception the all subsidiary [url=http://www.casinolasvegass.com]casino[/url] las vegas at www.casinolasvegass.com with onto 75 swell unstinting [url=http://www.casinolasvegass.com]online casino[/url] games like slots, roulette, baccarat, craps and more and attain a crushing in faithful craftiness with our $400 untied of attention bonus.
we be smarting with even-handed safer games then the warmly trained online [url=http://www.place-a-bet.net/]casino[/url] www.place-a-bet.net!
Hello,
I'm seeking help for the kids of Haiti.
I'm here for a non-profit organization that gives their time to
building oppurtunities for the kids in haiti. If anybody wants to donate then this is the site:
[url=http://universallearningcentre.org]Donate to Haiti[/url] or Help Haiti
They give kids in Haiti a learning environment.
Please check it out, they're legit.
Please help us
Ola, what's up amigos? :)
I will be happy to receive some assistance at the start.
Thanks and good luck everyone! ;)
Hi, as you may already noted I'm new here.
In first steps it is very good if someone supports you, so hope to meet friendly and helpful people here. Let me know if I can help you.
Thanks in advance and good luck! :)
[COLOR="Red"][B]Click on the pictures to view in full size[/B][/COLOR]
[URL=http://www.wallpaperhungama.in/details.php?image_id=12779][IMG]http://www.wallpaperhungama.in/data/media/32/Asin-80.jpg[/IMG][/URL]
[URL=http://www.wallpaperhungama.in/details.php?image_id=7237][IMG]http://www.wallpaperhungama.in/data/media/32/Asin-71.jpg[/IMG][/URL]
[url=http://www.wallpaperhungama.in/cat-Asin-32.htm][b]Asin Hot Wallpapers[/b][/url]
Photo gallery at t WallpaperHungama.in is dedicated to Asin Pictures. Click on the thumbnails into enlarged Asin pictures, exclusive photographs and snobbish photos. Also validate out other Pictures Gallery through despite Squeaky grade and Strong Decision twin scans, talking picture captures, moving picture promos, wallpapers, hollywood & bollywood pictures, photos of actresses and celebrities
Hi all,
I'm here again I've set up my new site regarding forex signal here
http://forexsignal.pipsmaker.com
Hope you enjoy it
Keep Researching
Coach is a leading American designer of luxury goodies, all the way from handbags coach handbags to jewelry and sunglasses to shoes. The coach makes one of the most popular and superior designer handbags and accessories on the market name. They are distributed through Coach 400 stores and more than 1200 joint U.S. retail. As a result of solid marketplace competition, [url=http://www.discountoncoach.com]coach online store[/url] website, as well as retailers are promoting and offering Coach handbags outlet coupons for reduced prices. These coupons are emailed to customers or it can be exploited by visiting the discount coupons offered by the company websites. You can easily find websites offering a Coach Outlet Coupon through the popular search engines. What you need to do is simply type the words "Coach Discounted Coupons" and you will get a list of sites from where you can avail promotional or discounted coupons for the purpose of buying purses and handbags of you desired brand. Some other search terms which can help you to find out a Coach Outlet Coupon include "coach shoes discount", "coach coupon codes", "coach promo codes", "coach discount handbags", "coach promotional codes", "coach purses discount", "coach bags discount", and "coach bag coupons".
To shop for fashionable [url=http://www.discountoncoach.com/coach/leather-bags]Coach Leather Bags[/url], visit [url=http://www.discountoncoach.com/coach/handbags]Coach Handbags[/url] Online Store. We give you best in the world and that too at very high discounted rate.
Hey friends
Meet nice girls from America:
VenAMi.com
[url=http://www.venami.com]VenAMi.com[/url]
Awesome pictures !
hi
i am trying to insert a [url=http://www.getapoll.com/]pol[/url]l intro this forum and i can't add the code from the page to this forum.
Is there a tutorial so i can add a poll?
i wan't to make a financial poll to know which services are better to apply payday loans or [url=http://www.usainstantpayday.com/]bad credit loans[/url]
thanks
Nireerpereogy
best online pharmacy zybanpharmacy zyban
[url=http://www.bebo.com/buylevitraonline1]buy levitra online gameday de[/url]
gret post
Hello Everybody,
My name is Mrs Sharon Sim. I live in Singapore and i am a happy woman today? and i told my self that any lender that rescue my family from our poor situation, i will refer any person that is looking for loan to him, he gave me happiness to me and my family, i was in need of a loan of S$250,000.00 to start my life all over as i am a single mother with 3 kids I met this honest and GOD fearing man loan lender that help me with a loan of S$250,000.00 SG. Dollar, he is a GOD fearing man, if you are in need of loan and you will pay back the loan please contact him tell him that is Mrs Sharon, that refer you to him. contact Dr Purva Pius,via email:(urgentloan22@gmail.com) Thank you.
Post a Comment
<< Home